Please cite your source when you share information from this document. This page was updated on 15 September 2025.
© 2006–2025 Alan Ng. Questions? Comments? Please use the easy Feedback Form. Thank you!
Help support irishtune.info.
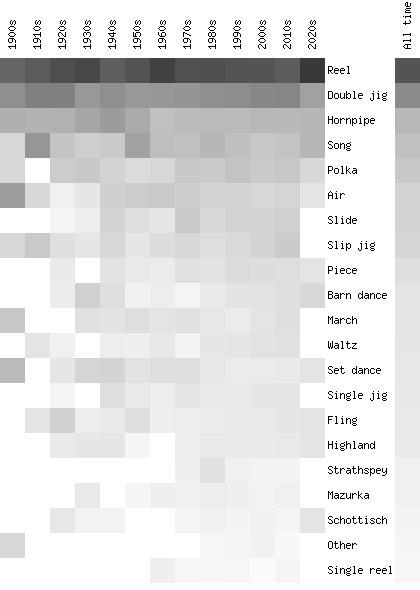
The graph below illustrates how the use of particular rhythms has changed over time, considering the history of commercial recordings of Irish traditional music. For example, you can read left-to-right across the graph to see when polkas went up (darker) and down (lighter) in popularity. And you can read up and down the graph to see which rhythms were the least popular (lightest) in in the 1920s.
![]() (black) = 100% of tune recordings during that decade
(black) = 100% of tune recordings during that decade
![]() (shading) = 50% of tune recordings during that decade
(shading) = 50% of tune recordings during that decade
![]() (white) = 0% of tune recordings during that decade
(white) = 0% of tune recordings during that decade

Note that this measures the number of recordings per decade, as opposed to the (smaller) number of musically distinct tunes per decade. Undated recordings are excluded from this graph.