Please cite your source when you share information from this document. This page was updated on 28 September 2024.
© 2001–2024 Alan Ng.
Questions? Comments? Please use the easy Feedback Form. Thank you!
Help support irishtune.info.
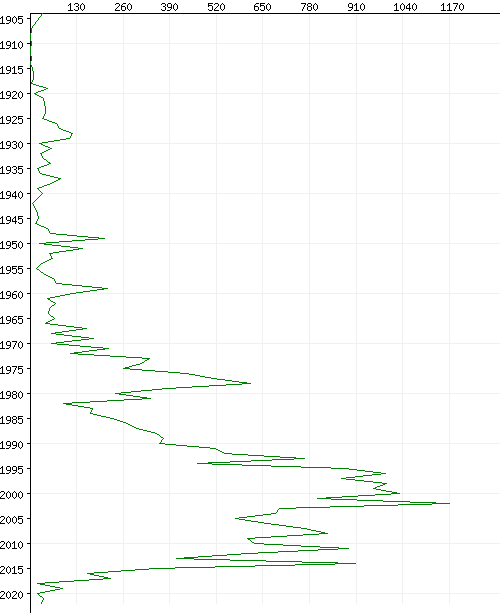
These two graphs depict the ebbs and flows, the boom and bust cycles of the recording industry in Irish traditional music. It counts how many of the individual tune recordings in this database were originally recorded in each year or decade. The original recording date of each tune (not the publication or reissue date) is considered here. See the Discography for a full list of my sources.
Note: The coverage here of recordings before the 1990s is strongly shaped by choices publishers have made for reissues and anthologies of those older recordings in modern CD format. Recordings made after 2015 are not yet well covered and are in progress.
Decade | Tune recordings | % | Bar graph |
---|---|---|---|
1900–1909 | 42 | 0.1% | |
1910–1919 | 90 | 0.3% | |
1920–1929 | 598 | 2.1% | |
1930–1939 | 423 | 1.5% | |
1940–1949 | 438 | 1.5% | |
1950–1959 | 737 | 2.6% | |
1960–1969 | 852 | 3.0% | |
1970–1979 | 3,247 | 11.3% | |
1980–1989 | 2,540 | 8.8% | |
1990–1999 | 7,367 | 25.5% | |
2000–2009 | 7,843 | 27.2% | |
2010–2019 | 4,532 | 15.7% | |
2020–2029 | 145 | 0.5% | |
Total | 28,854 | 100% |